Despite having worked in industries cutting across voice design, mobility, industrial spaces, and aviation, one constant has been working with data. Either consciously or not, I've always had to figure out how to work with large amounts of information (not exclusively quantitative or qualitative) aka data.
As I'm starting a new project, it's given me the time to reflect about how my design practice has changed and evolved in working with data. I've mentioned bits and pieces of this in different blog entries as well, but thought this would serve as a nice way to tie in all the learnings.
Discovery vs management
This is one that has stuck with me from my first project at GE: the design concept of either discovery - where you get a chance to dive deep into the data and might be looking for trends (e.g. your Instagram feed) vs management - where you are reacting to alerts, notifications, and tickets (e.g. responding to comments on your posts). In many ways, it can be reframed as being proactive or passive in the way that your team works with data.
Navigating levels of data
Navigating data is its own world. I've written before about navigating information through voice, and navigating data is a similar type of problem.
For example, I used a simple framework to talk about navigating through voice:
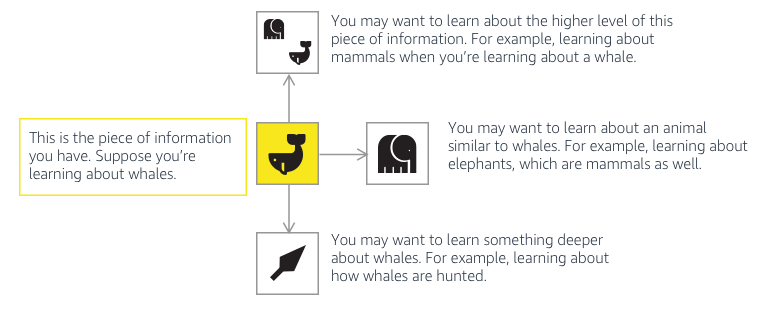
I recently came up with a very simplistic framework to try and explain how data was presented to different stakeholders depending on what they're looking for.

It's important to think about not only how the data is navigated within a particular application, but if it's necessary to show all levels to all stakeholders.
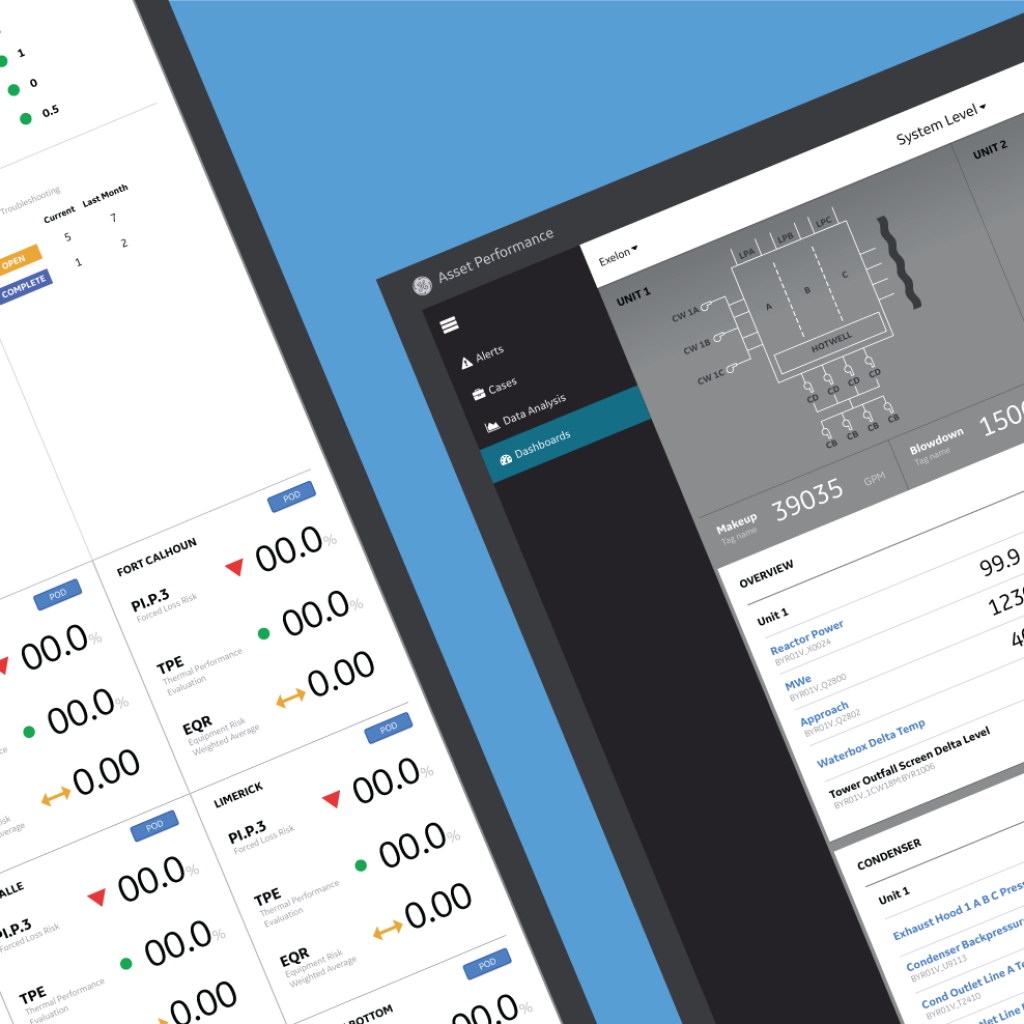
A while ago I worked on a dashboard for nuclear power plants basically had to design for 3 different users and conveniently fit into three varying data depth levels. The data levels also reflected the actual physical assets of the plant (part to whole relationship).
While I thought I had it wrong at first, I realized that we could just make one product, and just use the filtering levels to get to the information that was needed. Based on the user type, the dashboard would just open to that view (user rights / access / customization / personalization / tenancy / permission).
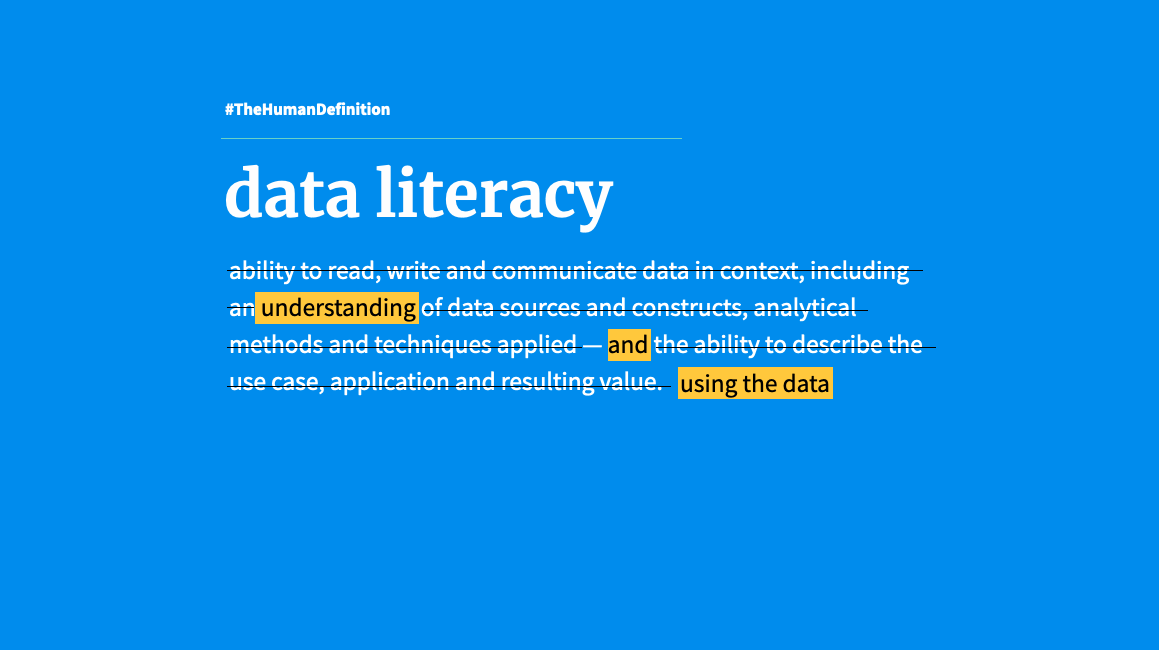
Data literacy
I've been using this term a lot more in the last year as I've been working with SMEs of data but also non-literate receivers of data. How do you make sure that the data is easily understood and makes sense to the receiver?
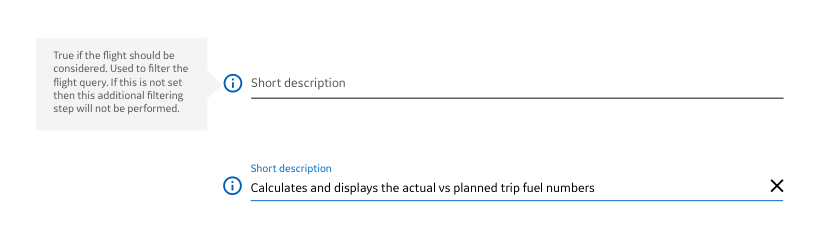
To this end, I've created specific features in apps that help users understand the data that is provided to them. This has taken the form of explanatory modals
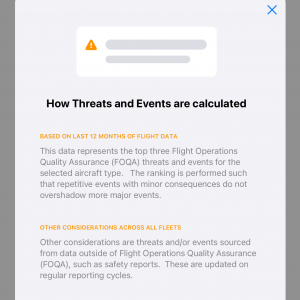
to tooltips in a configuration console
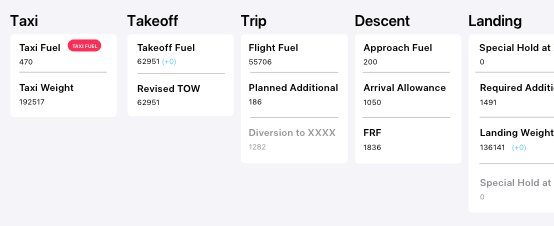
to just providing some information that they might already know about how something is used or planned out (this is showing how fuel was planned and accounted for for a flight).
Provide context!
Data by itself is essentially useless. As designers, I believe it's on us to provide context within the design to help the user understand the data. Some of the criteria for providing context can be simple:
- Time frames (Over how many years / months / days was this data collected? Can you show it seasonally? Or by recency?)
- Data sources (What is the source of the data? How was this data calculated?)
- Level (At what level is this data? Is it a data point or an average or the sum of millions of points?)
- Data stability / quality / reliability (How often is the data pipeline broken?)
I discovered this incredible KPI (key performance indicator) worksheet in my time at GE that I've gone back to over and over because it's such a great way to break down a specific data point.

Running data discovery workshops is a way to do the KPI worksheet collectively. I created a basic framework and tested it with my team first.

I made them use the color of the sticky notes to mimic each of the criteria for 3 different metrics (in black). As silly as this feels, it was such a great to 1. visualize the sheer variety of ideas but 2. to clearly see how we were thinking of the same metric so differently. This is helpful to be able to start building a cohesive understanding of a metric.
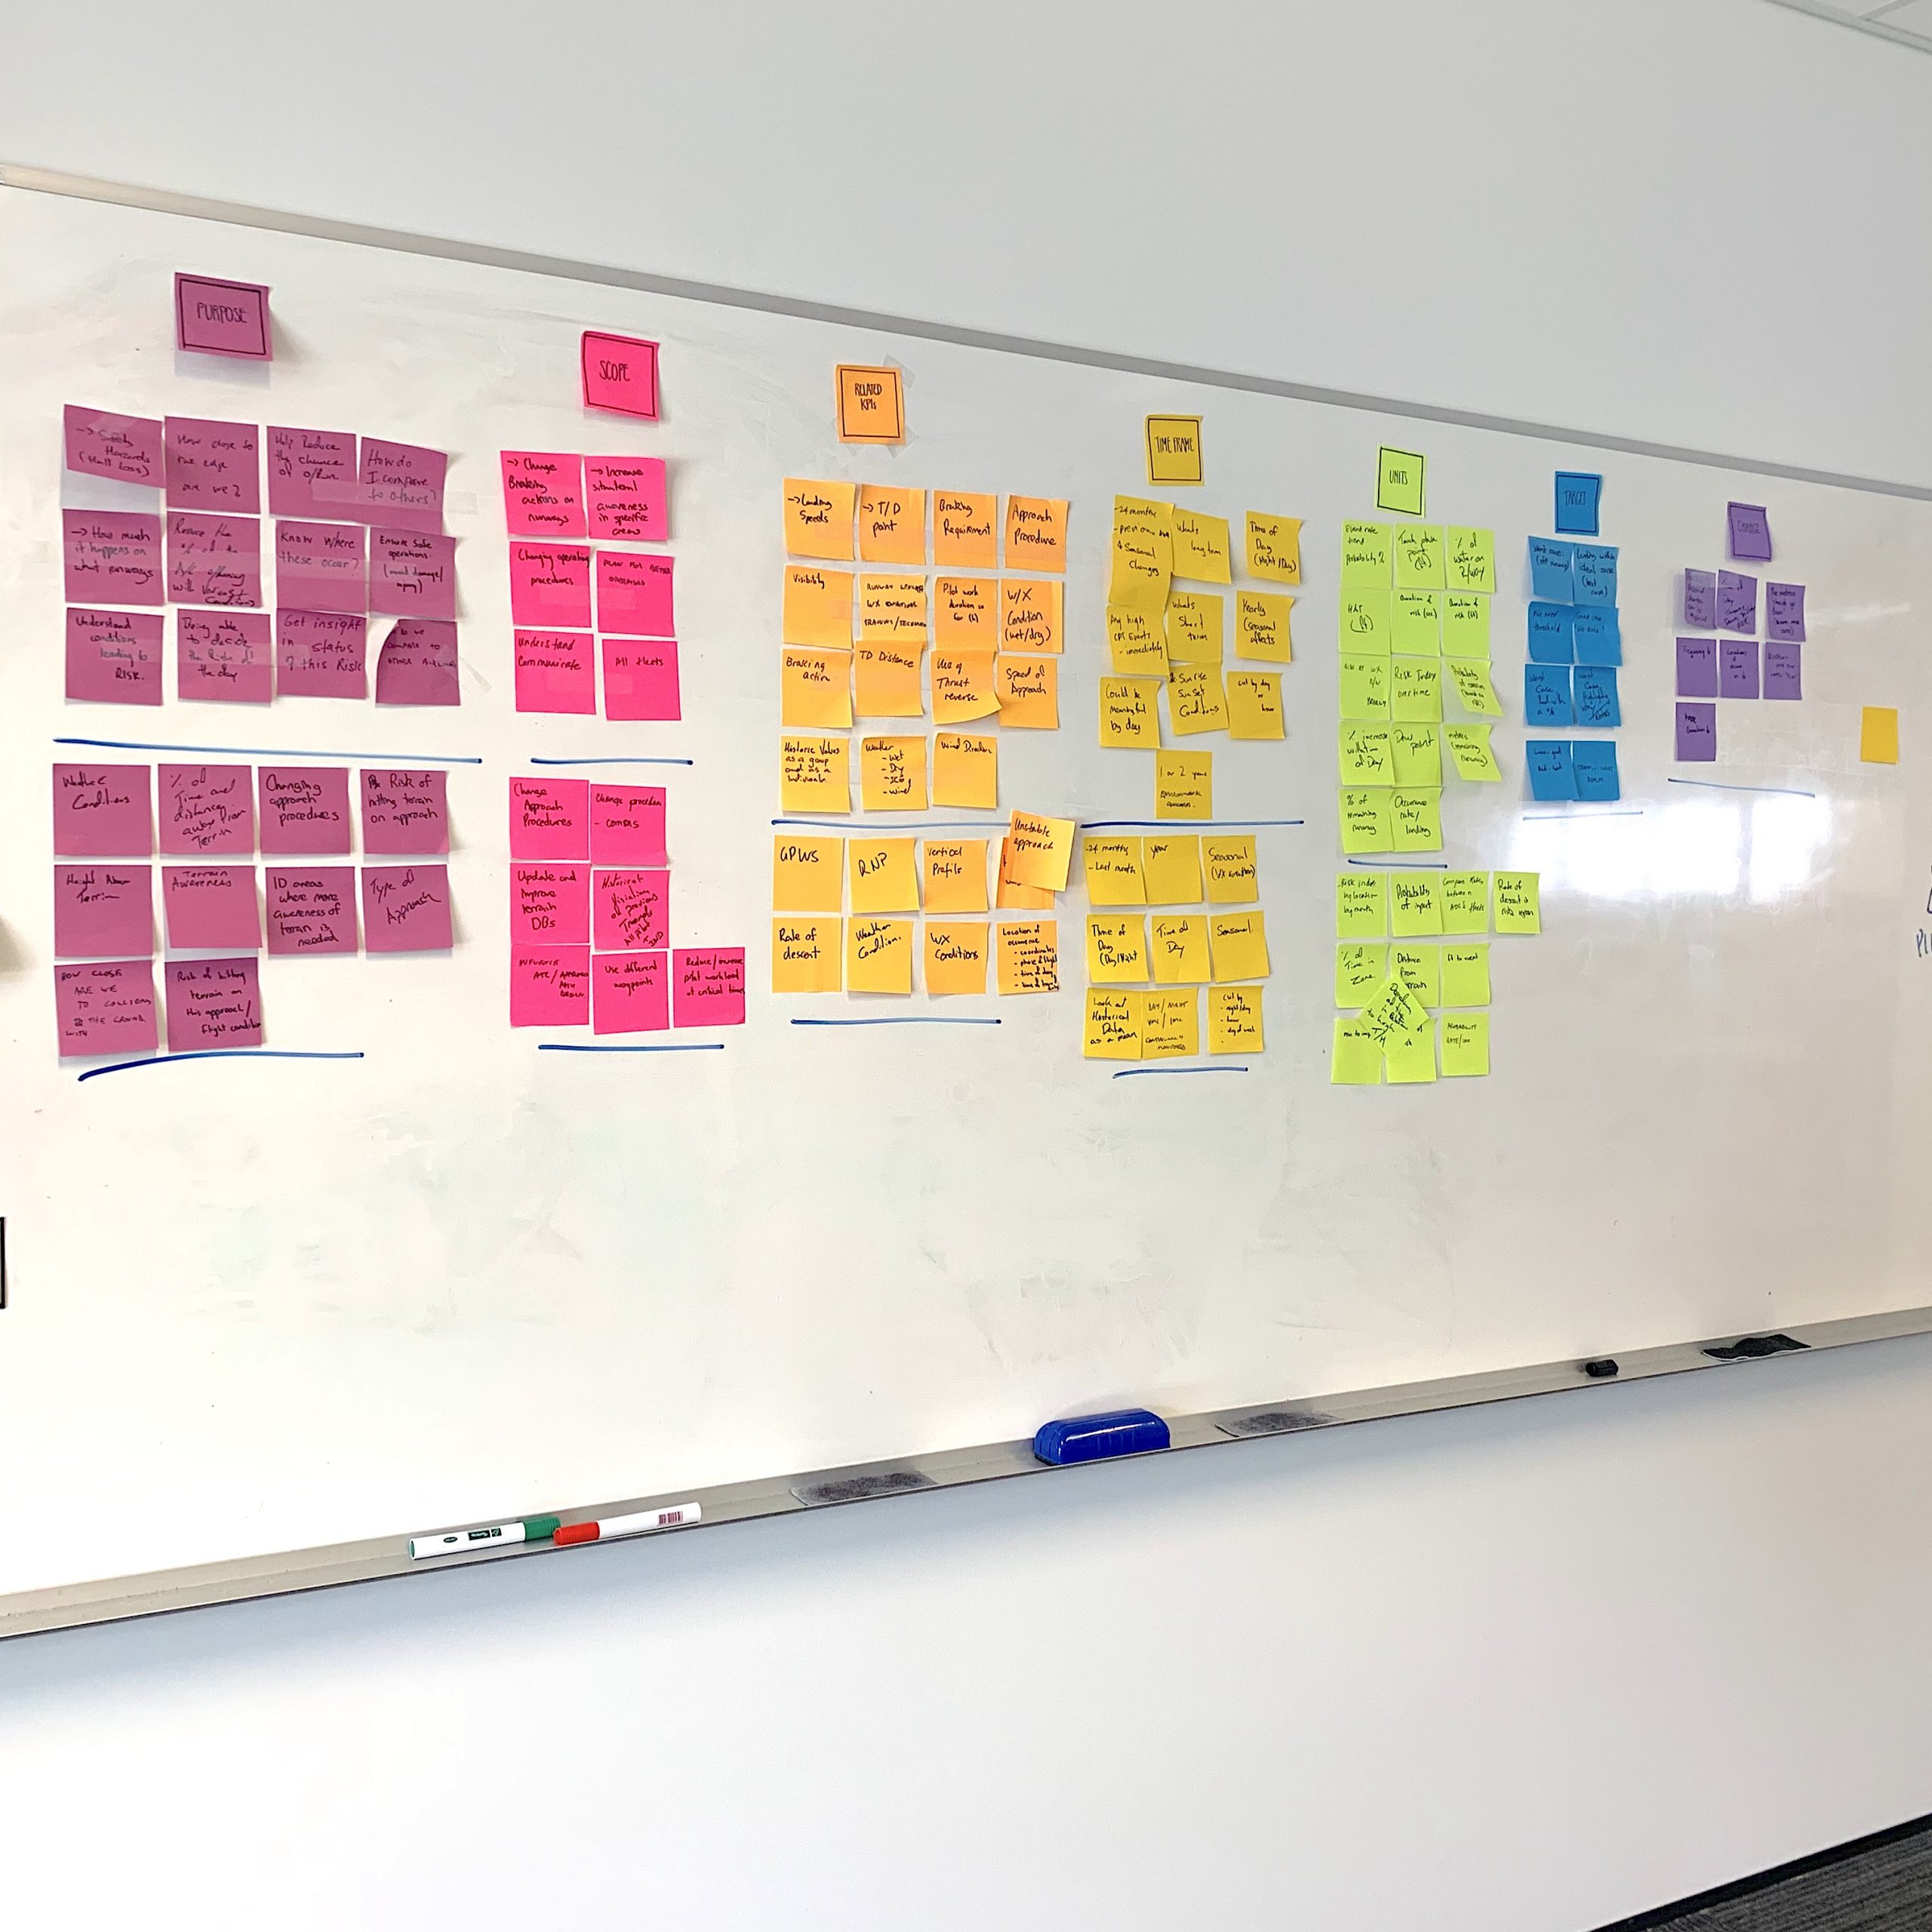
After running it with the team, I ran the session with a larger working group and even iterated on the original framework to simplify it.
Data is a living organism
You have to feed it and take care of it. The health of your data matters on the health of your asset (if it's coming off of something physical). While planes have always created and stored data, the use of that data for asset management has been quite slow. So when data pipelines are broken, nobody realizes unless someone goes digging. I've quite fallen in love with the idea of the health score / report card for your data, but also conscious that it might create another tool and task on an analyst's to-do list.
Understanding data pipelines also means understanding at which part of the pipe / process you might be getting the data. When data is filtered, cleaned, and processed (much like how milk is pasteurized before you get it neatly in a carton), you have to be sure that you're not looking at it at a stage where it might have little bits of dirt floating in it (hey the cow might have dirty udders).
When you think about getting data off of physical assets in particular, the concept of asset performance management (how the part is doing) and asset lifecycle management (looking at the part over its entire life to better manage it) exist but there is so much opportunity to do more with it.
This is part 1 of this series, as I'll explore more about ethics and design concepts in part 2.
No Comments.